We keep an eye on your website uptime so you don’t have to
Website downtime is one of the leading causes for revenue loss. By the time you know your website is down, you’ve lost customers, been inundated on social media and left a bad impression of your brand. We’re here to stop that.
Use our Uptime Monitoring and we’ll alert you as soon as your website goes down in any of your selected countries. Problem solved.


Choose how we check your website uptime
Use our market exclusive constant check rates and customise who gets alerted of website downtime and how with our uptime monitoring solution. Want check rates every 30 seconds? Done.
See what check rates StatusCake offersSee historical uptime monitoring reports
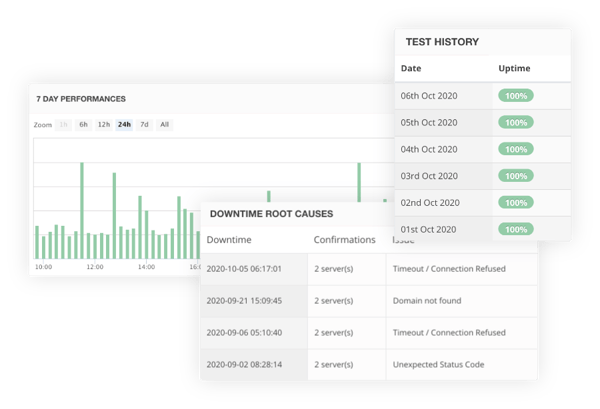
We keep uptime tests results for up to a month, so you can keep on top of historical website outages. Compare these to your website uptime reports in real time so you can see if your website performance is improving or declining.
See how you can make uptime reports

Find out more about website downtime causes
Our uptime monitoring gives you everything you need to see what’s causing your website downtime with information on status codes, ping and test locations making it easier for you to make more informed decisions.
Location, location, location
With paid accounts, you can choose where your website uptime tests are run from. So if your website is down in the UK but not America, you'll know about it.
See StatusCake test locations
We support alerts on 14 different platforms, including...

DataDog

Discord

OpsGenie

Pushover

Slack

Telegram

Google SSO & StatusCake
Online security is more important than ever, and that’s why we’ve made it our mission at StatusCake to ensure our customers’ accounts are kept safe & secure on our platform.
To help this further we’ve recently released Google Single Sign On! The biggest plus point? No more pesky passwords to remember! The cherry on top is that Google SSO is available for ALL of our customers.Use Google SSO on your account by signing up today or updating your details
Knowledge base
Useful articles relating to StatusCake Uptime Monitoring
Why do I need uptime monitoring?
Regardless of the size of your company, uptime monitoring can be the difference between hitting your revenue targets and falling short. Even the smallest of businesses that are new to the online world still need to maintain an online presence, securing much-needed customer trust, retention, and ultimately, satisfaction. And what does this bring? Revenue.

