Want to know how much website downtime costs, and the impact it can have on your business?
Find out everything you need to know in our new uptime monitoring whitepaper 2021


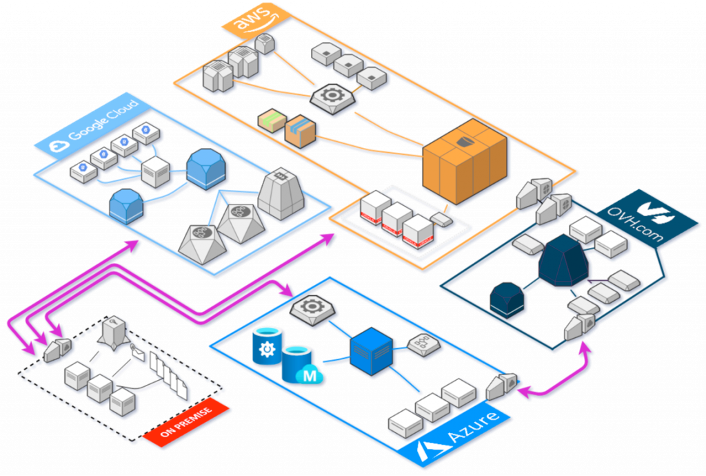
Running infrastructure at scale almost always guarantees dizzying complexity and anxiety-inducing pressure to maintain systems in a production environment. This is further exacerbated when multiple delivery teams require slight variations of the same infrastructure components, across several cloud providers, each with a different set of observability requirements. Gradually, production environments become large, unmanageable, difficult to change, and perhaps resembling the figure below. But there must be a better way, ensuring infrastructure remains fluid, auditable, and where changes can be managed centrally to promote both visibility and shared responsibility.

In a cloud environment, infrastructure has typically been managed manually through each cloud provider’s respective web platform, each presenting their version of the same compute resources uniquely; expecting users to internalise the platform’s idiosyncrasies required to provide the resources they need. Steadily, this has resulted in the development of professional roles dedicated to managing these resources, taking control away from the software developers making use of them. With this we have, as an industry, creating a further divide between those developing applications that run in production and those that ensure they continue to operate, thus establishing an unbalanced competency across the organisation.
Due to this, it is fair to assert that most software developers are unfamiliar with how the production software they create is performing, or even worse when it becomes unavailable.
At StatusCake, we build infrastructure checks that are both scalable and reliable. Through our intuitive web application, both developers and operations staff alike can create monitoring resources to ensure applications remain operational and perform as expected. However, as production systems grow and the demand for more monitoring checks becomes apparent, keeping track of what monitors exist and which are still to be realised becomes difficult.
In this article, we’ll explore the complexities of monitoring larger infrastructures and how StatusCake solves these problems with simple automation tools.
Before we continue, let’s first introduce a scenario outlining the problem we’re attempting to solve. Imagine for a moment that we’ve been tasked to create uptime monitors for each of our 50 production services, with each one requiring a different tolerance before alerts are sent out to the respective delivery teams.
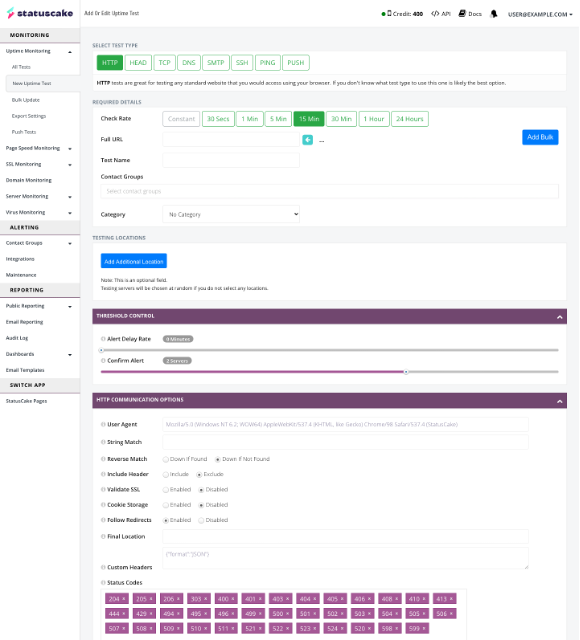
In the past, we may have created each one of these monitors individually through a web UI, making sure that we input the correct value for each given field. When we’re done, we’d pray that we had not made a mistake.

Now imagine management has informed us that service downtime is not enacted quick enough and that we need to decrease the alert tolerances across all the current monitors. Additionally, the support team needs to be made aware of any outages so they can better handle customer issues. This is where the terror sets in as we’re forced to click through every monitor and edit each one manually.
This problem never eases and as more changes are requested, we’re forced to make manual edits. Here at StatusCake we identify with this issue and to solve it we have turned to Terraform.
At this point you may be asking yourself, what is Terraform, and how does it solve the problems discussed above. The Terraform website has a succinct answer to this question and describes it as follows:
“Terraform is an infrastructure as code tool that lets you define both cloud and on-prem resources in human-readable configuration files that you can version, reuse, and share.”
https://www.hashicorp.com/products/terraform
Alright, but what does this mean and how does it fit into current practices? At its core, Terraform is a command-line application for managing and provisioning infrastructure resources by promoting a DevOps methodology and transparent workflow. This implies that it should fit into any organisation already employing DevOps best practices – including version control, knowledge sharing, and automation (CI/CD). Terraform achieves this by requiring authors to create configuration files written in a proprietary language, HashiCorp Configuration Language, acting as the source of truth and describing the infrastructure holistically. A minimal example of such a file is as follows.
resource "statuscake_contact_group" "operations_team" {
  name = "Operations Team"

  email_addresses = [
    "[email protected]",
    "[email protected]",
  ]
}
Adding these configuration files to version control should be considered the norm and is the primary method to enable auditability and change management across the infrastructure. Smaller chunks of configuration can even be reused in the form of modules – generalised units of infrastructure with configurable variables. Modules can increase the manageability of infrastructure, and expedite the release of similar components with slight variation. For example, it may be necessary to enforce that all staff on the operations team are included in the list of alert recipients for each configured StatusCake contact group but still allow for additional recipients. This can easily be achieved with a single module.
# ./modules/statuscake/contact_group/main.tf
variable "name" {
  type = string
}

variable "email_addresses" {
  type    = list(string)
  default = []
}

resource "statuscake_contact_group" "contact_group" {
  name = var.name

  email_addresses = concat([
    "[email protected]",
  ], var.email_addresses)
}

output "id" {
  value = statuscake_contact_group.contact_group.id
}

# ./main.tf
module "operations_team" {
  source = "./modules/statuscake/contact_group"
  name   = "Operations Team"
}

module "development_team" {
  source = "./modules/statuscake/contact_group"
  name   = "Development Team"

  email_addresses = [
    "[email protected]",
  ]
}
Given a collection of configuration files, Terraform can be instructed to enact the desired state of the infrastructure and provision (or update or delete) the described resources. We will not dive into how Terraform achieves this as there are many other articles available, including Terraform’s own website.
To find out more about using the Terraform command-line application, take a look at the documentation on the Terraform website.
Now that we have a little background on the Terraform tool, let’s focus on how it can be used to build a better application monitoring suite. At StatusCake, we have developed our own Terraform provider that can be used to build out the different types of monitors supported by the platform using the same declarative language introduced above. If we were to use the same scenario from before we can create our monitors in such a way that encourages future change and visibility across the delivery team.
To begin, we first need to instruct Terraform of the providers we intend to use and supply any required configuration values. In the case of the StatusCake provider, we need only supply our API key. Your API Key can be found in the account settings when logged in to the StatusCake App.
provider "statuscake" {
  api_token = "my-api-token"
}
After this we declare two contact groups, making use of the module we created in a previous section.
module "operations_team" {
  source = "./modules/statuscake/contact_group"
  name   = "Operations Team"
}

module "development_team" {
  source = "./modules/statuscake/contact_group"
  name   = "Development Team"

  email_addresses = [
    "[email protected]",
  ]
}
These modules will be used later to reference the IDs of the provisioned contact groups when creating our monitors. Next comes the part of the configuration that defines the monitors we wish to create. It may come across as rather verbose but will prove useful when changes are required.
variable "monitors" {
  type = map(object({
    trigger_rate = number
    address      = string
  }))

  default = {
    "monitor1" = {
      trigger_rate = 2
      address      = "https://www.example.com"
    },
    "monitor2" = {
      trigger_rate = 5
      address      = "https://www.example.co.uk"
    },
  }
}
For brevity, we’ve only defined 2 of our monitors, but this variable could be extended to include all the monitors necessary to cover our infrastructure. Briefly, we have defined a variable of type map. The keys of the map are expected to be of type string, representing the name of the monitor, and the values of the type object. This object may only have two properties, trigger_rate (number) and address (string). No other fields or value types will be accepted.
Now that we have defined the monitors we intend to create, we need to declare the “shape” of our uptime monitoring resource. If you’re familiar with procedural programming languages, you will undoubtedly be comfortable using loops to perform similar operations over a collection of values. Terraform has its own construct to work with loops but they work in much the same way. We’ll implement a loop to declare all our monitors using the same resource template.
resource "statuscake_uptime_check" "uptime_check" {
  for_each = var.monitors

  name           = each.key
  check_interval = 30
  trigger_rate   = each.value.trigger_rate

  # reference the id of the contact groups from above
  contact_groups = [
    module.operations_team.id,
    module.development_test.id,
  ]

  http_check {
    follow_redirects = true
    validate_ssl     = true

    status_codes = [
      "202",
      "404",
      "405",
    ]
  }

  monitored_resource {
    address = each.value.address
  }
}
Running this configuration file through the Terraform command line will create each of the monitors we described.
Finally, responding to the change request from earlier is as simple as updating the values in the monitor variable and including an additional contact group configuration. Looking at the diff we can see a minimal number of changes.
module "development_team" {
  ]
}

+ module "support_team" {
+   source = "./modules/statuscake/contact_group"
+   name   = "Development Team"
+
+   email_addresses = [
+     "[email protected]",
+     "[email protected]",
+     "[email protected]",
+   ]
+ }

variable "monitors" {

  default {
    "monitor1" = {
-     trigger_rate = 2
+     trigger_rate = 1
      address = "https://www.example.com"
    },
    "monitor2" = {
-     trigger_rate = 5
+     trigger_rate = 2
      address = "https://www.example.co.uk"
    },
  }

resource "statuscake_uptime_check" "uptime_check" {
  contact_groups = [
    module.operations_team.id,
    module.development_team.id,
+   module.support_team.id,
  ]

  http_check {
Again, running this through the Terraform command line will align the new desired state with the StatusCake platform.
Terraform can truly transform how infrastructure and applications are deployed within a delivery team. It has a clear advantage over using web-based applications and even improves upon the user experience of APIs by allowing simple automation, a declarative configuration language, and modulation of code for many different providers which can be used to create an end-to-end solution.
Share this

3 min read IPFS is a game-changer for decentralised storage and the future of the web, but it still requires active monitoring to ensure everything runs smoothly.

3 min read For any web developer, DevTools provides an irreplaceable aid to debugging code in all common browsers. Both Safari and Firefox offer great solutions in terms of developer tools, however in this post I will be talking about the highlights of the most recent features in my personal favourite browser for coding, Chrome DevTools. For something

6 min read There has certainly been a trend recently of using animations to elevate user interfaces and improve user experiences, and the more subtle versions of these are known as micro animations. Micro animations are an understated way of adding a little bit of fun to everyday user interactions such as hovering over a link, or clicking

2 min read Read about the latest websites that have experienced downtime including Netflix, Twitter, Facebook and more inside!

2 min read Read about how Google suffered an outage due to the soaring temperatures in the UK in July and how they rectified it right here!

3 min read See the results of our website downtime survey to see some of the most shocking and surprising stats! You won’t be disappointed.
Find out everything you need to know in our new uptime monitoring whitepaper 2021